

Choose easy, medium, or tricky questions from our skill libraries to assess candidates of different experience levels.
Choose easy, medium, or tricky questions from our skill libraries to assess candidates of different experience levels.

Choose easy, medium, or tricky questions from our skill libraries to assess candidates of different experience levels.

Choose easy, medium, or tricky questions from our skill libraries to assess candidates of different experience levels.
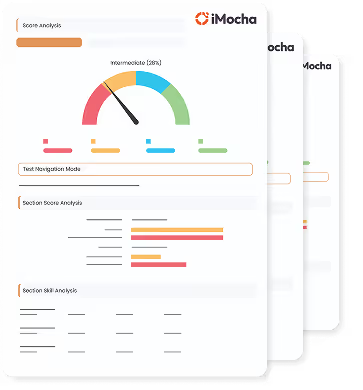
This a comprehensive PDF report, which you can instantly download and share with your hiring team or candidates for seamless collaboration.
Download Sample Report


Our Google Data Studio online test is the ideal pre-employment assessment for recruiters & hiring managers to assess candidates' proficiency in data visualization and analytical skills. This test assesses candidates' knowledge of topics like pivot charts, data studio filters, and reports. This test has helped our customers reduce their hiring costs and time-to-hire by 45%.


%20(1).webp)
Google Data Studio turns data into informative reports and interactive dashboards that are easy to read and share and are fully customizable for your business intelligence needs. Google Data Studio can connect to a variety of data sources, including Google Analytics. You can also upload your Excel data using the CSV format.
The Google Data Studio online test helps employers to assess candidates' Google Data Studio analytical skills. The Google Data Studio skills test is designed & validated by experienced Subject Matter Experts (SMEs) to assess and hire Google Data Studio Experts per industry standards.

The Google Data Studio skills test helps to screen the candidates who possess the following traits:
Using powerful reporting, you can have a detailed analysis of our test results to make a better hiring decision and predict candidates' performance. To know about candidates' experience, we have introduced a new feature called the 'candidate feedback module' in our Google Data Studio online test, so you can ensure that candidates are getting an excellent experience while attempting the test.
The Google Data Studio skills test may contain MCQs (Multiple Choice Questions), MAQs (Multiple Answer Questions), Fill in the Blanks, Whiteboard Questions, Audio/Video Questions, AI-LogicBox (AI-based essay evaluation), Job-based Simulations, True or False Questions, etc.


.webp)
.webp)
.webp)
.webp)