Join iMocha's Executive Roundtable Series — Atlanta, Dallas, LA
Express Interest


The Seaborn test evaluates candidates' proficiency in creating informative and attractive statistical graphics using Python's Seaborn library. It identifies skilled data visualizers who can handle color palettes, interpret heatmaps, manage large datasets, and style plots for dashboards. This assessment helps recruiters hire efficient analysts who transform complex data into compelling visuals, reducing visualization errors and accelerating decision-making in data-driven teams.
color palettes, heatmaps interpretation, large datasets handling, plot styling for dashboards, data visualization techniques, statistical plots
Data Analyst, Data Scientist, Visualization Engineer, BI Developer
Ability to select and apply appropriate color palettes for effective data representation
Proficiency in interpreting and creating heatmaps to reveal data patterns
Experience handling and visualizing large datasets without performance issues
Skill in customizing plot styles to meet dashboard design requirements
Understanding of integrating Seaborn with other Python libraries for comprehensive visualizations
iMocha's Seaborn test provides deep insights into candidates' ability to craft visualization palettes and interpret heatmaps through scenario-based MCQs and coding challenges. It benchmarks performance against industry standards, ensuring reliable identification of proficient users. With AI-proctored exams in secure browser environments, it maintains high integrity for unbiased hiring.

Choose easy, medium, or tricky questions from our skill libraries to assess candidates of different experience levels.
Choose easy, medium, or tricky questions from our skill libraries to assess candidates of different experience levels.

Choose easy, medium, or tricky questions from our skill libraries to assess candidates of different experience levels.

Choose easy, medium, or tricky questions from our skill libraries to assess candidates of different experience levels.
The Seaborn test thoroughly evaluates candidates' expertise in leveraging Seaborn's high-level interface for elegant statistical graphics. It includes MCQs on applying color palettes for better readability, interpreting heatmaps to identify correlations in multivariate data, optimizing visualizations for large datasets using efficient rendering techniques, and styling plots with themes and annotations for professional dashboards. Scenario-based questions test real-world application, such as integrating Seaborn with Pandas for exploratory data analysis or Matplotlib for custom tweaks.
This assessment identifies professionals who can produce publication-quality figures, crucial for roles in data science and analytics, ensuring hires contribute to streamlined reporting and enhanced stakeholder engagement.
Wondering what other skills we have?
Checkout world’s largest Skills Assessment Library.
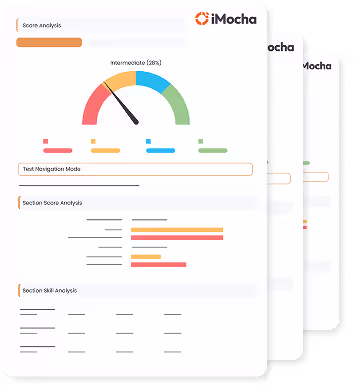
This a comprehensive PDF report, which you can instantly download and share with your hiring team or candidates for seamless collaboration.
Download Sample Report