HomeData Science Tests
Data Storytelling Skills Test
Test duration:
30
min
No. of questions:
20
Level of experience:
Mid/Senior

Data Storytelling Skills Test

Use this assessment to make smarter hiring and upskilling decisions. Assess Excel, Tableau, and other data skills. It can even help you save 45% on hiring time and identify skill-gap to create dedicated learning programs.

A computer monitor displaying a data visualization with a graph and a pie chart
Capgemini
Deloitte
The United Nations
The United Nations
Fujitsu
The United Nations

What is Data Storytelling?

It is the method of building a contextual narrative after analyzing a data set. It is the "last mile" of data science. It has four key components — character, setting, conflict, and resolution.

The process organizes data into decipherable information through data visualization so it can lead to making informed decisions.

Why Use iMocha's Data Storytelling Skills Test?

This skill test measures candidates' and employees' ability to create meaningful visuals that effectively inform their audience, prepare comprehensive presentations, and share their findings in an understandable manner. Additionally, to safeguard the integrity of individuals and the accuracy of the test results during their assessment, you can employ numerous anti-cheating measures provided along with this assessment.

Wondering what other skills we have in our World’s Largest Skills Assessment library?
Visit here
How it works

Test Summary

iMocha's test assesses candidates for multiple skill sets, including:

  • Technical data management and visualization tools like Microsoft Power BI, Excel, Tableau, KNIME, etc.
  • Data visualization techniques like scatter plots, charts, histograms, treemaps, etc., and visualization skills.
  • Finding insights through preprocessing and data wrangling and analyzing.
  • Business acumen to understand the business context, along with the goals.
  • Problem-solving related to incomplete data sets, incorrect visualization, etc.

Upon completion of tests, results are immediately created and delivered to the test administrator, along with critical data (such as live stream recordings and screen captures) to assist you in filtering out unfit candidates faster.

Useful for hiring
  • Data Storyteller
  • Data Visualization Specialist
  • Data Analyst
  • Data Journalist
  • Marketing Executive
  • Market Research Analyst
Test Duration
30
min
No. of Questions
20
Level of Expertise
Mid/Senior
Topics Covered
Shuffle

Shuffle

Shuffle

Shuffle

Shuffle

Sample Question
Choose from our 100,000+ questions library or add your own questions to make powerful custom tests.
Question type
Topics covered
Difficulty

Question:

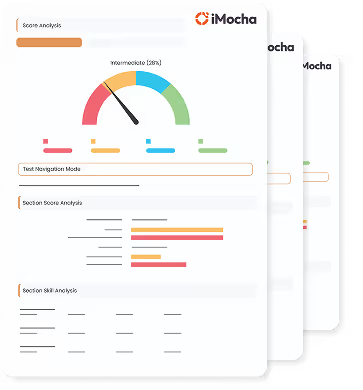
A helicopter view of the employee's progress
Test Report
You can customize this test by

Setting the difficulty level of the test

Choose easy, medium, or tricky questions from our skill libraries to assess candidates of different experience levels.

Combining multiple skills into one test

Add multiple skills in a single test to create an effective assessment and assess multiple skills together.

Adding your own
questions to the test

Add, edit, or bulk upload your coding, MCQ, and whiteboard questions.

Requesting a tailor-made test

Receive a tailored assessment created by our subject matter experts to ensure adequate screening.
FAQ
How is the data storytelling skills test customized?
Down Arrow Circle

iMocha's SMEs custom create the questions of the assessment to help you assess technical and non-technical skills in a single dashboard. Using this test, you can assess skills like data visualization, statistics, preprocessing critical thinking, attention to detail, etc. You can even add/remove the questions according to your requirement and choose different difficulty levels.

What are the most common interview questions related to this skill?
Down Arrow Circle

Some of the common questions that are asked in interviews are:

  • In the context of storytelling of data, what is a story?
  • What is meant by narrative visualization?
  • Have you used stories to support visualization? Give an example.
  • How can you make infographics more effective?
  • What are the most common errors that one can spot in data sets while creating a visualization?
  • What does "data journalism" mean?
  • Where do you find inspiration while creating new data visualizations or building a narrative?  

If you are looking for more individualized interview questions, iMocha can help!

What are the required skill sets to work on data storytelling?
Down Arrow Circle

Here is a list of common technical and non-technical skills required for this role:  

Technical skills

  • Data visualization techniques like infographics, charts, etc
  • Data wrangling and preprocessing
  • Programming (Python, R, etc.)
  • Microsoft Power BI KNIME
  • Excel
  • Tableau
  • Ability to spot errors in data sets like corrupted, incorrect, etc.  

Soft skills

  • Analytical thinking  
  • Problem-solving  
  • Time management
  • Communication
  • Teamwork
  • Patience