
The HR metrics that prove revenue impact are the ones finance already recognizes: external hiring cost avoided, revenue capacity recovered through faster time to productivity, and revenue at risk reduced by retaining critical skills. Each needs a skills-level leading indicator, such as critical skills coverage or internal fill rate, so the board sees cause before outcome.
Most CHROs already report plenty of workforce analytics. The gap is translation. Headcount, engagement, and training hours describe activity, and a board prices outcomes. This guide gives you a three-ledger scorecard that connects skills supply and demand data, internal mobility, and workforce planning decisions to numbers a CFO will sign off on, plus the formulas, a worked example with real math, and a one-page board format. If you run skills analytics across your workforce, most of the inputs already exist.
Key takeaways
- Stop claiming HR "drove" revenue. Claim what you can defend: cost avoided, revenue capacity protected, and revenue risk reduced, each kept in its own ledger.
- Pair every financial number with a skills-level leading indicator. Lagging HR metrics arrive after the decision window has closed.
- Agree unit costs with finance before the meeting. A board will accept a conservative number it trusts over a large number it has to debate.
- Internal fill rate for critical roles is the single most useful bridge metric, because it moves cost, capacity, and risk at the same time.
Why do boards discount most HR metrics?
Boards discount HR metrics because most of them report effort, and directors are paid to judge returns. A slide showing 42,000 training hours or a four-point engagement lift invites one question the CHRO usually can't answer in the room: what did the company get for it?
The stakes behind that question are large. When the McKinsey Global Institute studied about 1,800 companies with more than $100 million in revenue, it found that compensation and organizational overhead together averaged 33% of revenue. In the same sample, R&D plus sales and marketing averaged about 12.5% of revenue.
Roughly one dollar in three of revenue goes to people and the systems around them.
A board that oversees capital spending line by line will eventually ask for the same discipline on that third. Regulation has pushed in the same direction, though less than many HR teams assume. In 2020 the SEC added human capital to the Regulation S-K business description, asking public companies to describe their human capital resources and the measures they manage by, to the extent those are material. The rule never defined which measures. In January 2026, SEC Chair Paul Atkins directed a comprehensive review of Regulation S-K to strip out immaterial disclosure. The proposals issued since have focused on filer status, semiannual reporting, and executive pay, and the human capital item still stands. Not everyone wants it kept: the Committee on Capital Markets Regulation has urged the SEC to let companies omit immaterial line items, naming human capital as an example.
That review matters for CHROs. If disclosure rules tighten around materiality, compliance stops being a reason for HR to have board time. The CHRO who keeps the seat will be the one who shows which workforce numbers are material to the plan.
Standards help with the what, less with the so-what. ISO 30414:2025, published in August 2025, sets out 11 human capital reporting areas, including costs, productivity, mobility and succession planning, and skills, capabilities, and development. It tells you what to measure consistently. It doesn't tell you how a change in skills coverage shows up in next year's revenue plan, and that link is what a board is actually asking for.
What is the three-ledger board scorecard?
The three-ledger scorecard sorts every HR metric you show the board into one of three financial questions: what did we avoid spending, what revenue capacity did we protect or create, and what revenue risk did we reduce. Each ledger runs as a chain from a skills signal to a talent decision, then an operating outcome, then a dollar figure finance has agreed to.
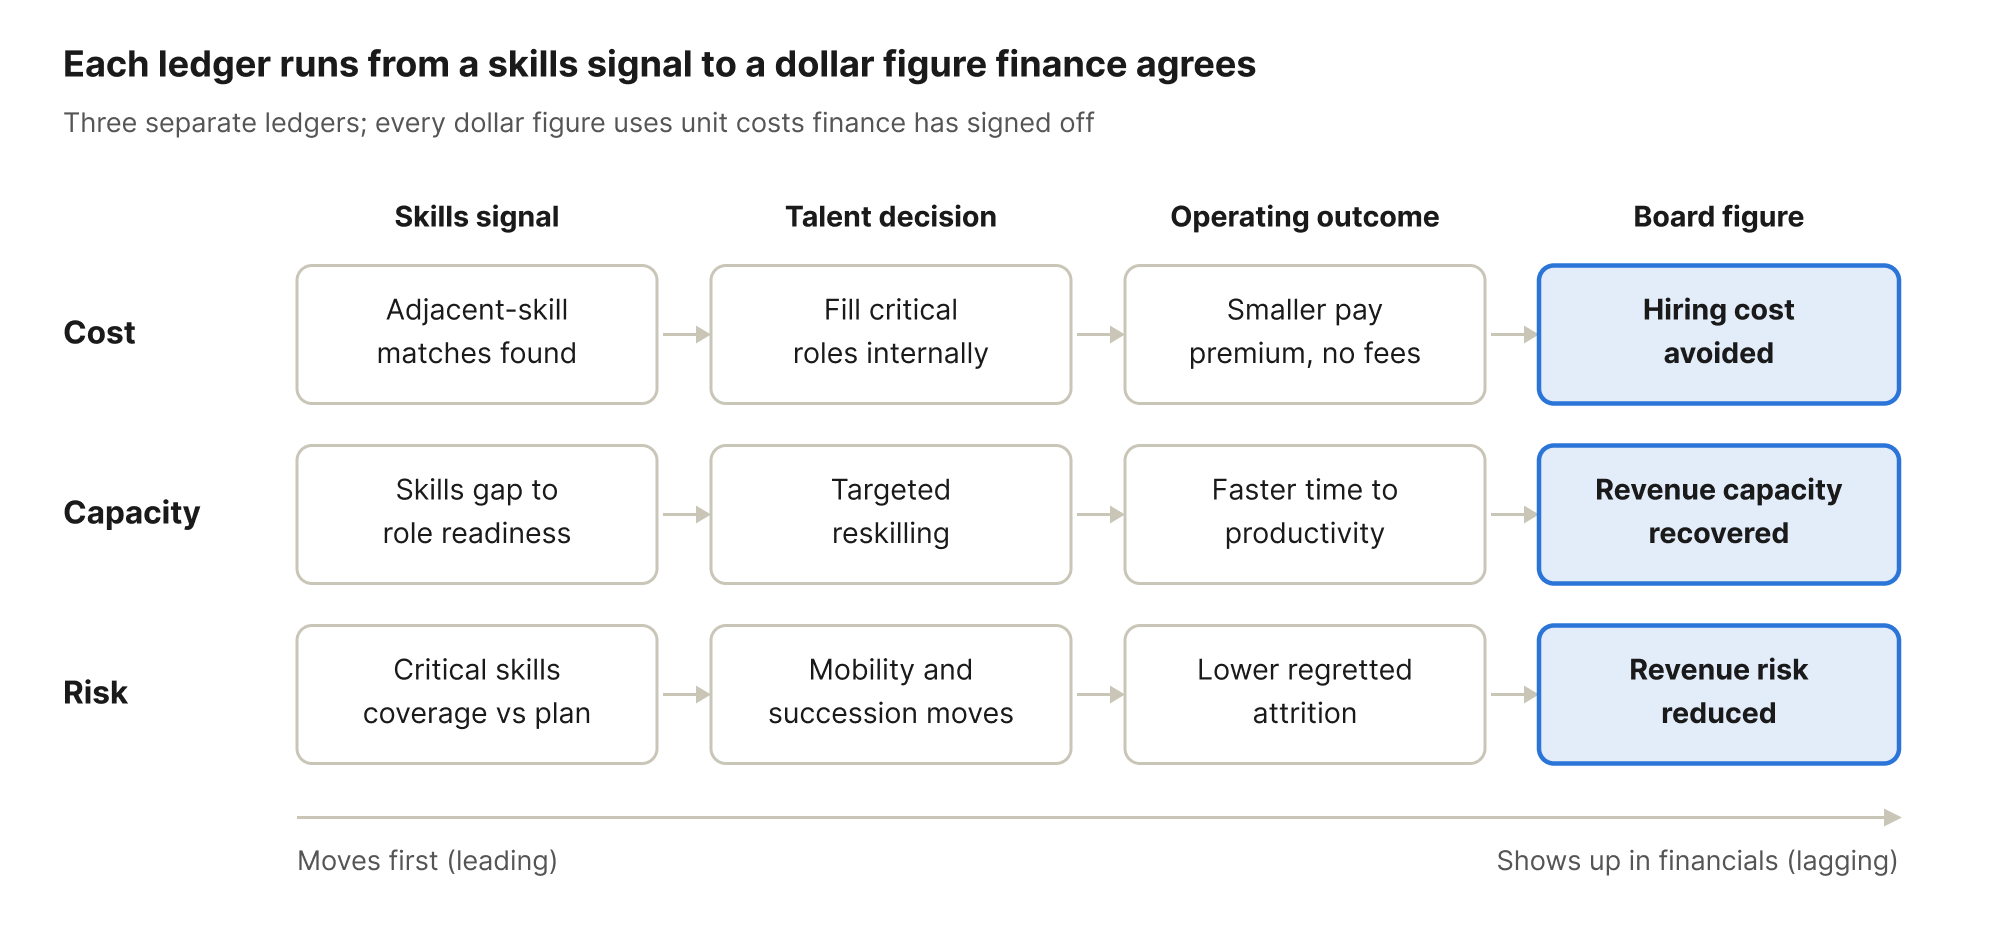
Read each row left to right: the skills signal moves first, and only the figure in the right-hand column goes on the board slide in dollars.
Here is the position this post takes, and some CHROs will disagree with it: don't try to attribute revenue to HR. Revenue has too many parents, and the first time a director asks how you isolated HR's share from pricing, product, and sales, the whole slide loses credibility. Show capacity and risk instead. A CFO can audit "we filled 60 billable roles 30 days sooner" in a way they can't audit "HR contributed 4% of revenue growth."
The three ledgers stay separate on purpose. Hiring cost avoided is a P&L saving. Revenue capacity is top-line potential that still depends on demand and sales. Retention risk is an expected value. Adding them into one HR ROI figure mixes three different kinds of money, and finance will pull it apart in the pre-read.
The left end of each chain is what makes the scorecard predictive. Traditional HR metrics such as attrition, time to fill, and cost per hire are lagging: by the time they move, the quarter is over. A skills layer, meaning validated data on which skills you have, where they sit, and how far they are from what the plan needs, moves first. When critical skills coverage for a product launch drops, you can see the revenue risk while there is still time to redeploy, reskill, or hire.
Which HR metrics belong on a board scorecard, and how do you calculate them?
Nine metrics cover most boards, three per ledger. Pick the subset that matches your plan; a services firm will lean on capacity, a regulated bank on risk. Limit the scope to critical role families, the roles the revenue plan can't be delivered without, because company-wide averages hide exactly the variance a board cares about.
| Ledger | Metric | How to calculate it | Where the data comes from |
|---|---|---|---|
| Cost | Internal fill rate, critical roles | Critical roles filled by internal candidates ÷ all critical roles filled | ATS and HRIS (Workday, SAP SuccessFactors) |
| Cost | External hiring cost avoided | Internal fills × (external cost per hire + first-year pay premium − internal move and reskilling cost) | ATS, compensation data, finance-agreed unit costs |
| Cost | Gap-targeted L&D share | L&D spend mapped to a top-priority skills gap ÷ total L&D spend | LMS plus skills gap analysis |
| Capacity | Time to productivity | Days from start to full quota, billability, or output standard, internal vs external | Sales ops, PSA or delivery systems |
| Capacity | Revenue capacity recovered | Revenue-bearing roles × days of vacancy or ramp avoided × revenue per role-day | Finance and delivery systems |
| Capacity | Human capital ROI | (Revenue − (operating expenses − pay and benefits)) ÷ pay and benefits | Income statement |
| Risk | Critical skills coverage | Validated supply of each plan-critical skill ÷ demand for it in the plan | Skills intelligence platform plus workforce plan |
| Risk | Regretted attrition cost, critical roles | Regretted exits × salary × agreed replacement multiplier | HRIS plus finance-agreed multiplier |
| Risk | Ready-now succession coverage | Critical roles with at least one ready-now internal successor ÷ all critical roles | Talent review plus skills data |
Two of these come from published methods. The human capital ROI formula appears in McKinsey Global Institute's 2023 human capital metrics list, which credits Jac Fitz-enz. The same study used internal moves as a share of all employee moves as one of its three markers of human capital development, and its top group of companies averaged 42% on that measure. That is a useful external reference point when your board asks what good looks like.
The replacement multiplier is where most CHROs overreach. Gallup estimates that replacing an employee costs one-half to two times their annual salary. Use the low end unless finance has a better internal figure. You will win more arguments with 0.5 than you lose by leaving money on the table.
The second table is the one to bring to your next board prep. It maps the metrics most HR dashboards already carry to a version a director can act on.
| What most HR decks show | What to show the board instead | Why it lands better |
|---|---|---|
| Training hours delivered | Share of L&D spend aimed at priority gaps, and gap closure on those skills | Ties spend to a named business need |
| Total headcount | Revenue per employee alongside human capital ROI | Shows output per dollar of people cost |
| Average time to fill | Revenue capacity lost to vacancy in revenue-bearing roles | Converts days into dollars |
| Engagement score | Regretted attrition in critical roles, valued in dollars | Prices the risk engagement is meant to signal |
| Number of internal moves | Internal fill rate for critical roles, plus hiring cost avoided | Separates strategic moves from churn |
| Size of the skills inventory | Critical skills coverage against the plan | Answers "can we deliver the plan?" |
Revenue per employee deserves one warning. On its own it rewards outsourcing and penalizes investment in capability, so a company can improve it by cutting the people who build next year's products. Show it only next to human capital ROI and critical skills coverage.
What does the math look like in practice?
A modest change in internal fill rate produces material numbers in all three ledgers, as long as the unit costs are agreed in advance. The numbers below are a labelled illustration with no customer data behind them. Replace every assumption with your own finance-approved figures before using it.
To put numbers on it: an enterprise fills 400 mid-level technical roles a year at an average base salary of $120,000. Today 20% are filled internally. After a year of skills-based matching, internal fill rises to 35%, which means 60 more roles go to internal candidates.
Four published figures anchor the assumptions. Wharton's Matthew Bidwell found that external hires were paid about 18% more than internal promotees in similar jobs, performed worse for their first two years, and left at higher rates. LinkedIn reported in 2022 that employees who made an internal move had a 75% chance of staying at the two-year mark, compared with 56% for those who hadn't. Gallup's replacement estimate supplies the multiplier, held at its low end of 0.5. SHRM's 2025 benchmark supplies the cost per hire, which understates most specialized technical hires because it averages all nonexecutive roles.
| Ledger | Assumption | Calculation | Result |
|---|---|---|---|
| Cost | 18% external pay premium on $120,000 = $21,600 per role; SHRM 2025 nonexecutive cost per hire of $5,475; an assumed $8,000 internal move and reskilling cost | 60 × ($21,600 + $5,475 − $8,000) | $1,144,500 first-year cost avoided |
| Capacity | Assumes 25 of the 60 roles bill at $1,200 a day and internal movers reach full billability 30 days sooner | 25 × 30 × $1,200 | $900,000 revenue capacity recovered |
| Risk | Two-year retention 75% vs 56%; replacement at 0.5 × $120,000 = $60,000 | 60 × 0.19 × $60,000 | $684,000 expected replacement cost avoided |
The three results stay in separate rows on purpose. The $1.1 million is a saving finance can trace to the P&L. The $900,000 is revenue capacity, so it only becomes revenue if demand is there to absorb it. The $684,000 is an expected value built on a correlation. Present all three, label each for what it is, and the board gets a fuller picture than a single blended ROI could give.
Three cautions belong in the speaker notes. Bidwell's core data comes from one US investment bank between 2003 and 2009, though he found the same pay and performance pattern in a second bank and a publishing company; hires' performance caught up within two to three years, so treat the premium as directional. His study also leaves out the cost of developing internal candidates, which is why the example nets out reskilling. And the LinkedIn retention gap reflects who chose to move as well as the move itself. All three are reasons to keep the multiplier conservative.
How should a CHRO present HR metrics to the board?
One page, three ledgers, one decision request. Board agenda time is scarce and the pre-read does much of the persuading, so the work happens weeks before the meeting.
- Start from the business plan. Name the three to five initiatives the board already tracks, such as a product launch, a market entry, or an AI rollout, and list the role families each one depends on. Those are your critical roles.
- Agree unit costs with finance first. Cost per external hire, revenue per billable day, and the replacement multiplier should carry the CFO's sign-off before any slide is built. This one step removes most of the debate in the room.
- Build a validated skills baseline for the critical roles. Measure supply (who has the skill, at what proficiency, verified how) against demand from the plan. Self-reported skills alone will overstate coverage. A skills gap analysis by role is the usual starting point.
- Set a baseline quarter and a counterfactual. State what would have happened without the program, for example the prior year's internal fill rate. Without a baseline, every improvement looks like noise.
- Lay out the page. One column per ledger. In each: the skills leading indicator, the operating outcome, the dollar figure, and the trend against last quarter. Put caveats in a footnote and keep the headline numbers clean.
- Close with a decision. Ask for something specific, such as approval to redirect part of the external hiring budget to reskilling for a named role family. A board that is asked to decide engages with the numbers; a board asked to note them skims.
Cadence matters too. Report the scorecard quarterly to whichever committee owns human capital oversight, often the compensation or human capital committee, and bring the full three-ledger view to the full board once a year alongside the workforce plan. Keep the metric definitions frozen for at least four quarters, because a scorecard that changes shape every meeting reads as a scorecard that is hiding something.
Where does skills data fit, and what can't it prove?
Skills data supplies the left-hand column of every ledger. Without it, internal fill rate is a count of moves with no explanation, and critical skills coverage can't be calculated at all. With it, the CHRO can show why a number moved: which people were matched, what gap was closed, and which external requisitions never opened.
Three capabilities matter most for board reporting. The first is skill adjacency, so you can see who is one or two skills away from a critical role instead of only who matches it today. The second is validation: skills profiles inferred from work data and confirmed through assessment, because self-declared profiles inflate coverage. The third is a demand view built from the workforce plan, so coverage is measured against what the business needs next year. iMocha's guide to skills intelligence for workforce mobility covers how that loop works, and the skills intelligence analytics reports map most of the leading indicators in this scorecard, including critical skills coverage and talent mobility readiness.
What this approach can't do
The three-ledger scorecard shows association and capacity. It cannot prove that HR caused revenue growth, and you shouldn't claim it does. McKinsey's researchers are careful on the same point: their revenue-per-dollar comparison doesn't control for other drivers of growth, and they write that no straight causal line can be drawn from their company examples to financial results. Skills intelligence also has limits of its own. It is built for knowledge and technical workforces, it isn't a scheduling tool for hourly or shift-based labor, and it doesn't replace your HRIS; it syncs with systems like Workday and SAP SuccessFactors. Finally, the scorecard is only as good as the skills baseline under it. Where most profiles in a critical role family are self-declared and unvalidated, label coverage as provisional on the slide.
FAQs
What is the best single HR metric to show a board?
Internal fill rate for critical roles. It links to hiring cost, time to productivity, and retention at once, and finance can verify it from system data.
How do you calculate human capital ROI?
Subtract operating expenses excluding pay and benefits from revenue, then divide by total pay and benefits. A result above 1.0 means that, after non-people operating costs, each dollar of pay and benefits is covered by more than a dollar of revenue.
Should HR claim a share of revenue growth?
No. Revenue attribution invites challenges HR can't win. Report cost avoided, revenue capacity recovered, and revenue risk reduced, each in its own ledger with finance-agreed unit costs.
How often should a CHRO report human capital metrics to the board?
Quarterly to the committee that oversees human capital, and annually to the full board alongside the workforce plan. Keep definitions stable for at least four quarters.
Do private companies need board-level HR metrics if the SEC rule doesn't apply?
Yes, if people costs are a large share of revenue. Lenders, private equity owners, and acquirers ask the same capacity and risk questions, and ISO 30414:2025 is written for organizations of all sizes and sectors.
What data do you need before building the scorecard?
A list of critical role families, finance-approved unit costs, a validated skills baseline for those roles, and at least one prior quarter of internal fill and attrition data to serve as the baseline.
Conclusion
A board will take HR's revenue contribution seriously when the evidence arrives in its own language. The HR metrics that prove revenue impact translate people decisions into hiring spend avoided, revenue capacity restored, and revenue risk lowered, each backed by a skills indicator that moved first and a unit cost finance already approved. Start with the critical roles behind your plan, agree the numbers with your CFO, and bring one decision to the table. The scorecard will earn more trust in two quarters than a decade of engagement trend lines.
Next step: see how the leading indicators in this scorecard are built in practice with iMocha's guide to mobilizing internal talent with skills intelligence.
Sources
- McKinsey Global Institute, Performance through people (February 2023)
- SEC press release 2020-192, Regulation S-K modernization
- SEC Chair Paul Atkins, Statement on Reforming Regulation S-K (January 13, 2026)
- Committee on Capital Markets Regulation, Optimizing the U.S. Public Company Disclosure Framework (April 2026)
- ISO 30414:2025
- Bidwell, Paying More to Get Less, Administrative Science Quarterly (2011), full text
- LinkedIn News, Talent Connect 2022
- Gallup, This Fixable Problem Costs U.S. Businesses $1 Trillion
- SHRM, 2025 Benchmarking Reports release (October 2025)